Group:
Faith Sutherlin
Jakob Wetmore
Jon King
Seth Johnston
Lab: Interpreting and Matching
Displacement vs. Time Motion Graphs
Objectives:
Materials:
TI-84 Calculator-Based Lab Unit (CBL-II)
Motion detector
Meter stick
Computer with LoggerPro software
Procedure:
Part I –
1. Develop a position vs. time story that describes a body in motion incorporating at least the following four types of motion.
i. standing still
ii. moving with constant velocity
iii. moving with variable negative velocity
iv. moving with variable positive velocity
2. Illustrate the story on a position vs. time graph. Use a legend to cross reference sections of the graph with the corresponding sections of the story.
3. Underneath the graph, write instructions for moving in front of the motion detector according to the graph you have drawn.
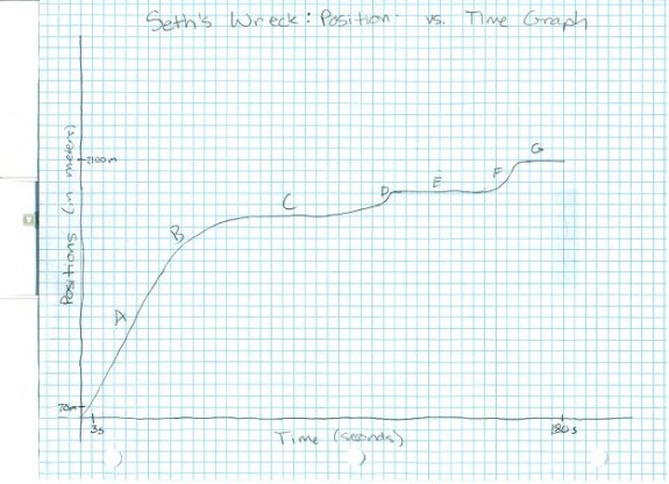
Story
A) As Seth embarked on his journey to school from the church parking lot, he accelerated to 45 mph for 65 seconds.
B) He then slowed down gradually to 30 mph as he entered the school zone for another 30 seconds.
C) Then Seth stopped for 25 seconds.
D) He sped up to 15 mph as the traffic in front of Dean Rusk began to move for 5 seconds.
E) Seth suddenly slammed on his brake; he had hit Carly from behind at 5 mph, which caused him to stop again for 30 seconds.
F) Seth’s car would not start, so a group of firemen and policemen helped push his truck into the junior parking lot, which gradually accelerated to 20 mph for 25 seconds.
G) It then rolled to a stop.
Directions for Moving
Keeping a binder or book in front of you, level with the motion detector, face the motion detector and move quickly at a constant speed for roughly one second, away from the machine. I reccomend taking about two steps. Then slow down for another two steps and stop for a short moment. Take a quick step, stop again. Take another quick step and stop again. I would attempt to outline the timeline for each motion in seconds, but that tended to be the challenge for my group. Repeat until it fits into the time frame--in our case, 5 seconds.
Part II – AT THE LAB STATION IN CLASS WITH A PARTNER
4. Measure out and mark meaningful locations on the floor and practice the motion needed to create the position vs. time graph.
5. Now it’s time for you to match your physical motion to your group’s descriptive motion graph. You have 3 attempts to match it as best you can. Save a copy best graph your motion creates and reproduce this graph using LoggerPro. Seth's Wreck: Position vs. Time Graph
2m on graph = 2100m in story
5 sec. on graph= 180 sec. in story
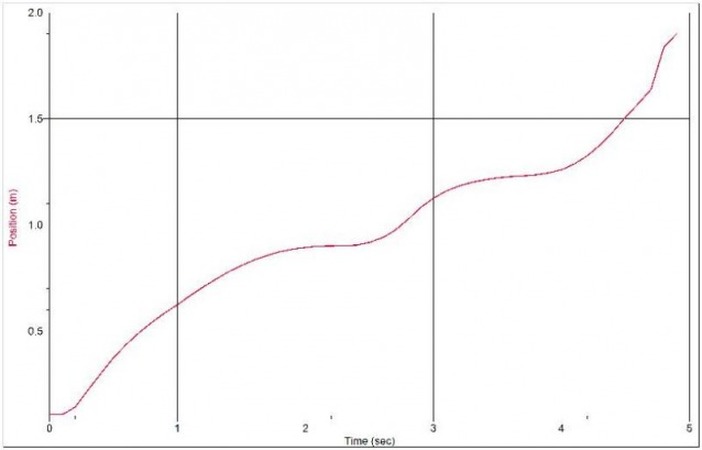
Data from Logger-Pro Graph
The first column is time in seconds and the second column is position in meters.
0 0.105788
0.1 0.10551
0.2 0.141051
0.3 0.220461
0.4 0.298761
0.5 0.373728
0.6 0.436757
0.7 0.491733
0.8 0.540601
0.9 0.584193
1 0.624176
1.1 0.66638
1.2 0.706085
1.3 0.743292
1.4 0.778832
1.5 0.808264
1.6 0.834086
1.7 0.855466
1.8 0.872681
1.9 0.88462
2 0.89295
2.1 0.89878
2.2 0.900446
2.3 0.901835
2.4 0.904334
2.5 0.917106
2.6 0.938208
2.7 0.974304
2.8 1.02595
2.9 1.08259
3 1.12507
3.1 1.16006
3.2 1.1831
3.3 1.20087
3.4 1.21281
3.5 1.2217
3.6 1.22808
3.7 1.23114
3.8 1.23586
3.9 1.24502
4 1.26001
4.1 1.28695
4.2 1.32554
4.3 1.3758
4.4 1.43716
4.5 1.50713
4.6 1.57099
4.7 1.63846
4.8 1.83865
4.9 1.90085
Your lab report should include your story and corresponding graph, and the graph made using the motion detector.
Data Analysis: Discuss differences between the descriptive graph and the graph generated by the motion detector. What are the reasons for the differences?
The descriptive draft that was drawn is not very different from the graph generated by the motion detecor. Some things that are different include the correct amount of slope as well as the ability to show zero velocity. This could be due to the inability of the motion detector to measure past two meters. Because of this, it was very difficult to fit all of the motions necissary into the 2 meters in 5 seconds. The inability to have zero slop could be due to a person not really able to stand completely still.
Faith Sutherlin
Jakob Wetmore
Jon King
Seth Johnston
Lab: Interpreting and Matching
Displacement vs. Time Motion Graphs
Objectives:
- Create a Displacement vs. Time graph and match your graph with actual motion.
- Gain competence in the use of motion detector and related equipment.
- Understand the relationship between position vs. time, velocity and acceleration.
Materials:
TI-84 Calculator-Based Lab Unit (CBL-II)
Motion detector
Meter stick
Computer with LoggerPro software
Procedure:
Part I –
1. Develop a position vs. time story that describes a body in motion incorporating at least the following four types of motion.
i. standing still
ii. moving with constant velocity
iii. moving with variable negative velocity
iv. moving with variable positive velocity
2. Illustrate the story on a position vs. time graph. Use a legend to cross reference sections of the graph with the corresponding sections of the story.
3. Underneath the graph, write instructions for moving in front of the motion detector according to the graph you have drawn.
Story
A) As Seth embarked on his journey to school from the church parking lot, he accelerated to 45 mph for 65 seconds.
B) He then slowed down gradually to 30 mph as he entered the school zone for another 30 seconds.
C) Then Seth stopped for 25 seconds.
D) He sped up to 15 mph as the traffic in front of Dean Rusk began to move for 5 seconds.
E) Seth suddenly slammed on his brake; he had hit Carly from behind at 5 mph, which caused him to stop again for 30 seconds.
F) Seth’s car would not start, so a group of firemen and policemen helped push his truck into the junior parking lot, which gradually accelerated to 20 mph for 25 seconds.
G) It then rolled to a stop.
Directions for Moving
Keeping a binder or book in front of you, level with the motion detector, face the motion detector and move quickly at a constant speed for roughly one second, away from the machine. I reccomend taking about two steps. Then slow down for another two steps and stop for a short moment. Take a quick step, stop again. Take another quick step and stop again. I would attempt to outline the timeline for each motion in seconds, but that tended to be the challenge for my group. Repeat until it fits into the time frame--in our case, 5 seconds.
Part II – AT THE LAB STATION IN CLASS WITH A PARTNER
4. Measure out and mark meaningful locations on the floor and practice the motion needed to create the position vs. time graph.
5. Now it’s time for you to match your physical motion to your group’s descriptive motion graph. You have 3 attempts to match it as best you can. Save a copy best graph your motion creates and reproduce this graph using LoggerPro. Seth's Wreck: Position vs. Time Graph
2m on graph = 2100m in story
5 sec. on graph= 180 sec. in story
Data from Logger-Pro Graph
The first column is time in seconds and the second column is position in meters.
0 0.105788
0.1 0.10551
0.2 0.141051
0.3 0.220461
0.4 0.298761
0.5 0.373728
0.6 0.436757
0.7 0.491733
0.8 0.540601
0.9 0.584193
1 0.624176
1.1 0.66638
1.2 0.706085
1.3 0.743292
1.4 0.778832
1.5 0.808264
1.6 0.834086
1.7 0.855466
1.8 0.872681
1.9 0.88462
2 0.89295
2.1 0.89878
2.2 0.900446
2.3 0.901835
2.4 0.904334
2.5 0.917106
2.6 0.938208
2.7 0.974304
2.8 1.02595
2.9 1.08259
3 1.12507
3.1 1.16006
3.2 1.1831
3.3 1.20087
3.4 1.21281
3.5 1.2217
3.6 1.22808
3.7 1.23114
3.8 1.23586
3.9 1.24502
4 1.26001
4.1 1.28695
4.2 1.32554
4.3 1.3758
4.4 1.43716
4.5 1.50713
4.6 1.57099
4.7 1.63846
4.8 1.83865
4.9 1.90085
Your lab report should include your story and corresponding graph, and the graph made using the motion detector.
Data Analysis: Discuss differences between the descriptive graph and the graph generated by the motion detector. What are the reasons for the differences?
The descriptive draft that was drawn is not very different from the graph generated by the motion detecor. Some things that are different include the correct amount of slope as well as the ability to show zero velocity. This could be due to the inability of the motion detector to measure past two meters. Because of this, it was very difficult to fit all of the motions necissary into the 2 meters in 5 seconds. The inability to have zero slop could be due to a person not really able to stand completely still.
Conclusion: Develop a conclusion that addresses the objectives of the lab.
In this lab, the group was able to obtain a greater understanding of position vs time graphs. This is obtained by having the group physically act out the motions in order to obtain a graph witht he simulator similar to the descriptive one. The lab also helps the students learn about how velocity and acceleration related to the graph. As the graph is concave up, a positive velocity is occuring. When it is concave down, the velocity is negative. When the graph is flat, the velocity is zero. Aslo, acceleration is a change in velocity. When the velocity changes on the grpah, the acceleration is also known to be changing.
